In programming and data science, histograms are a foundational tool used to visualize the distribution of datasets. When you analyze data in software, you often encounter distributions that aren’t simple and smooth — sometimes they have two distinct peaks, a phenomenon known as a bimodal histogram.
Recognizing bimodal histograms programmatically is essential for tasks such as data cleaning, clustering, anomaly detection, and machine learning preprocessing. This article dives into what bimodal histograms are, how to generate and interpret them in code, and how to leverage them for better data insights.
What is a Bimodal Histogram in Programming?
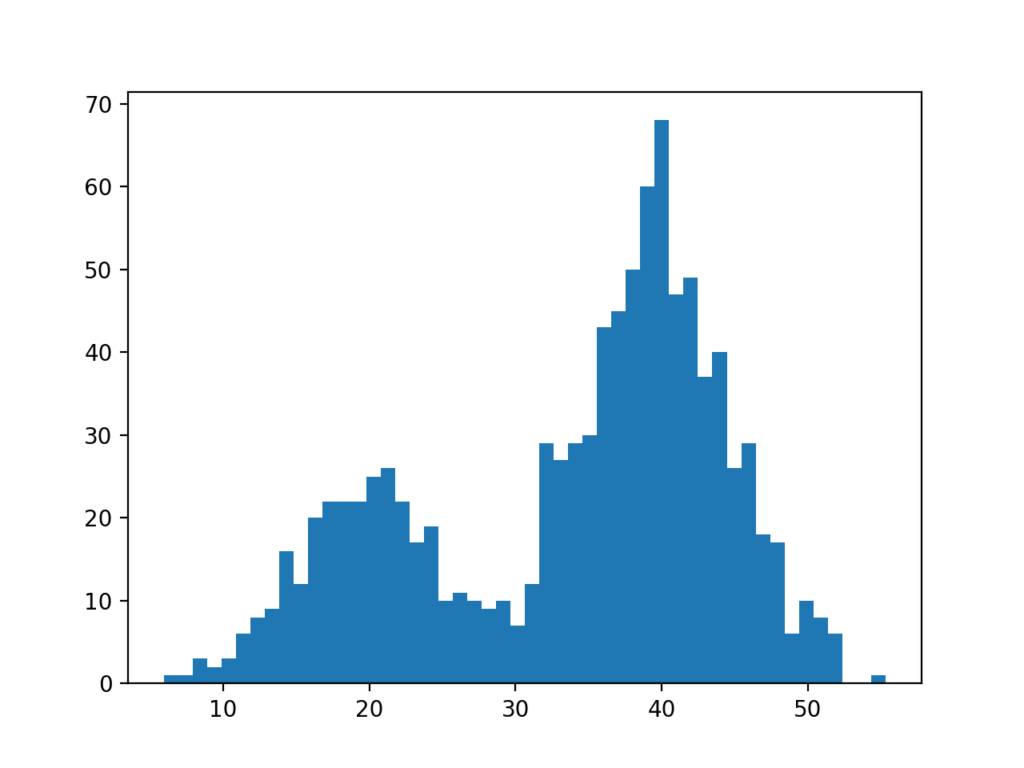
A bimodal histogram is a frequency plot with two prominent peaks indicating two modes or dominant value clusters in a dataset. This can happen when data comes from two different distributions combined into one.
In programming terms:
- You have an array or list of values.
- You group these values into bins (ranges).
- You count how many values fall into each bin.
- The resulting histogram shows two peaks.
Why Do Programmers Care About Bimodal Histograms?
- Data Understanding: Detecting multiple clusters or subpopulations.
- Preprocessing: Separating data into meaningful groups for machine learning.
- Anomaly Detection: Peaks may represent normal vs. abnormal data.
- Algorithm Tuning: Bimodality can indicate feature engineering opportunities.
How to Create a Bimodal Histogram in Programming
Example 1: Python
Python is often the go-to for data analysis due to libraries like NumPy and Matplotlib.
pythonCopyEditimport numpy as np
import matplotlib.pyplot as plt

# Generate bimodal data from two normal distributions
data1 = np.random.normal(30, 5, 500)
data2 = np.random.normal(70, 5, 500)
data = np.concatenate([data1, data2])

# Create histogram
plt.hist(data, bins=40, color='blue', edgecolor='black')
plt.title('Bimodal Histogram Example')
plt.xlabel('Value')
plt.ylabel('Frequency')
plt.show()
This code generates two data clusters, combines them, and plots a histogram that clearly shows two peaks.
Example 2: Java
Java doesn’t have built-in histogram plotting, but you can compute bin counts easily and use libraries like JFreeChart or export data for plotting.
Here’s a simple example calculating a histogram array for bimodal data:
javaCopyEditimport java.util.Arrays;

public class BimodalHistogram {
    public static void main(String[] args) {
        // Simulated bimodal data
        double[] data = new double[1000];
        for (int i = 0; i < 500; i++) {
            data[i] = 30 + 5 * Math.random(); // Cluster around 30
        }
        for (int i = 500; i < 1000; i++) {
            data[i] = 70 + 5 * Math.random(); // Cluster around 70
        }

        int binCount = 40;
        int[] bins = new int[binCount];
        double min = Arrays.stream(data).min().getAsDouble();
        double max = Arrays.stream(data).max().getAsDouble();
        double binWidth = (max - min) / binCount;

        for (double d : data) {
            int binIndex = (int) ((d - min) / binWidth);
            if (binIndex == binCount) binIndex--; // edge case
            bins[binIndex]++;
        }

        // Print histogram counts
        for (int i = 0; i < binCount; i++) {
            System.out.printf("Bin %2d [%6.2f - %6.2f): %d%n", i, min + i*binWidth, min + (i+1)*binWidth, bins[i]);
        }
    }
}
You can then visualize this data using a charting library or export it.
How to Detect Bimodality Programmatically
Detecting bimodality involves more than just plotting; you can:
- Analyze histogram bins for two clear local maxima.
- Compute bimodality coefficients using skewness and kurtosis.
- Apply statistical tests like Hartigan’s Dip Test (Python libraries available).
- Use mixture models to fit two distributions and evaluate if the fit improves.
Example in Python to calculate bimodality coefficient:
pythonCopyEditfrom scipy.stats import skew, kurtosis

def bimodality_coefficient(data):
    s = skew(data)
    k = kurtosis(data, fisher=False)  # Pearson's kurtosis
    n = len(data)
    bc = (s**2 + 1) / k * (n - 1)**2 / ((n - 2) * (n - 3))
    return bc

bc = bimodality_coefficient(data)
print("Bimodality Coefficient:", bc)
Use Cases in Programming & Data Science
- Clustering: Bimodal histograms hint at natural clusters, guiding k-means or Gaussian Mixture Models.
- Feature Engineering: Features with bimodal distributions can be split or transformed.
- Quality Control: Monitoring sensor data or logs where bimodality indicates a system state change.
- Anomaly Detection: Abnormal states appear as secondary modes.
Tips for Programming Bimodal Histograms
- Choose Bin Width Carefully: Too wide hides peaks; too narrow adds noise.
- Use Sufficient Data: Small datasets may show false bimodality.
- Combine with Statistical Tests for confirmation.
- Use Visualization Libraries: Matplotlib (Python), JFreeChart (Java), Plotly, or D3.js for interactive exploration.
Summary
A bimodal histogram in programming is a critical tool to detect when data represents two distinct distributions. By generating histograms and combining them with statistical tests and visualizations, programmers can extract valuable insights that drive better modeling and decision-making.
Sources
Berkeley – data visualisation principles
UCLA – more details